Mapping
by Antony Feeny1
Opera Europa is regularly asked by its members for information on how their particular opera company compares with other opera organisations. Often they are responding to their governments, or to the country’s media, or to the company’s directors, or to some other relevant stakeholders, who are keen to investigate how they measure up – or sometimes are just looking for reasons to criticise their performance.
| Item | Total Figure | Range per company | Average per company |
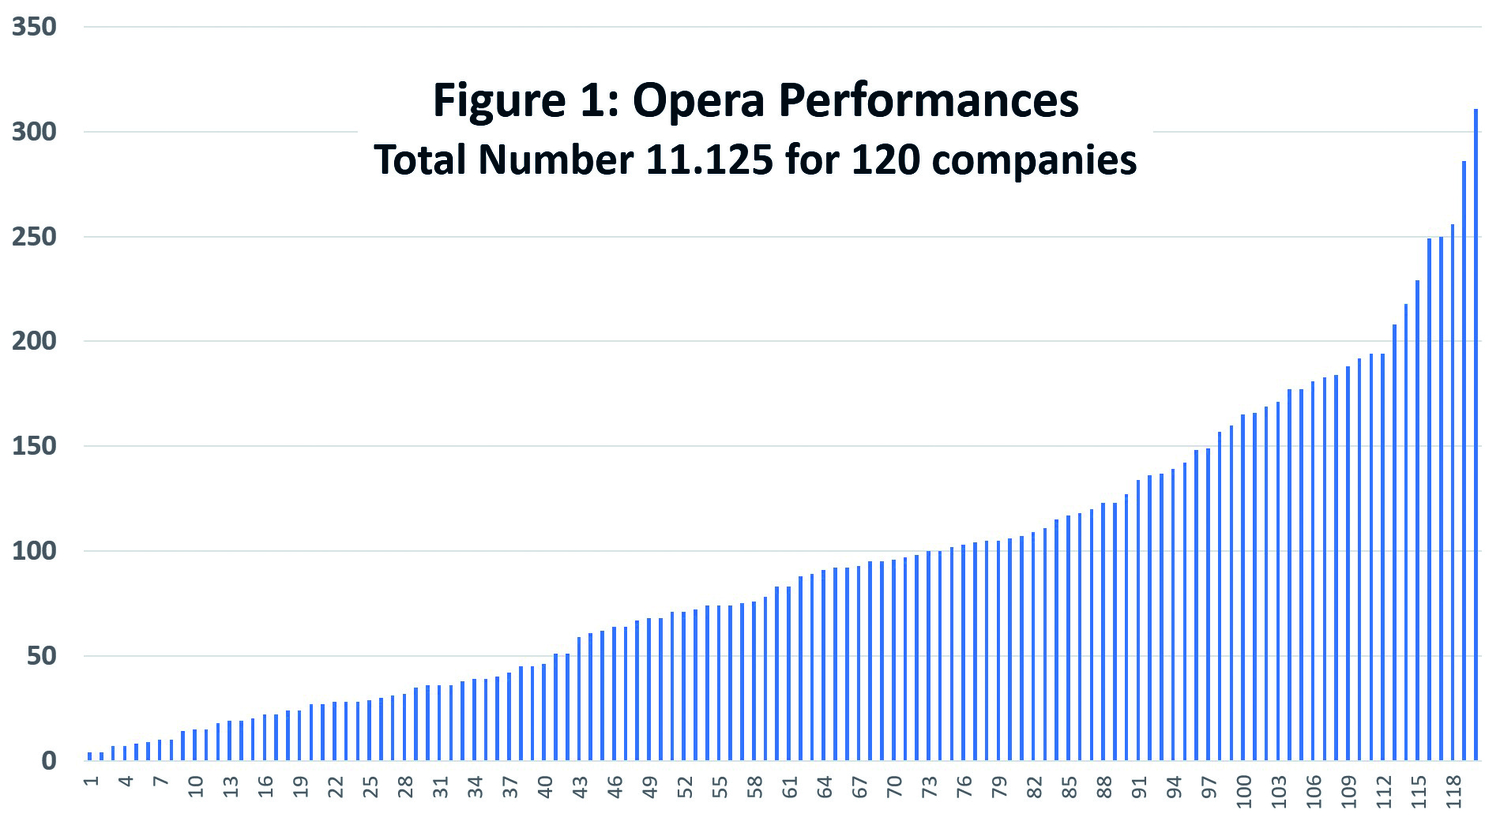
| Opera Performances | 11.125 | 4 – 311 | 93 |
| Opera Productions | 1.499 | 1 – 56 | 13 |
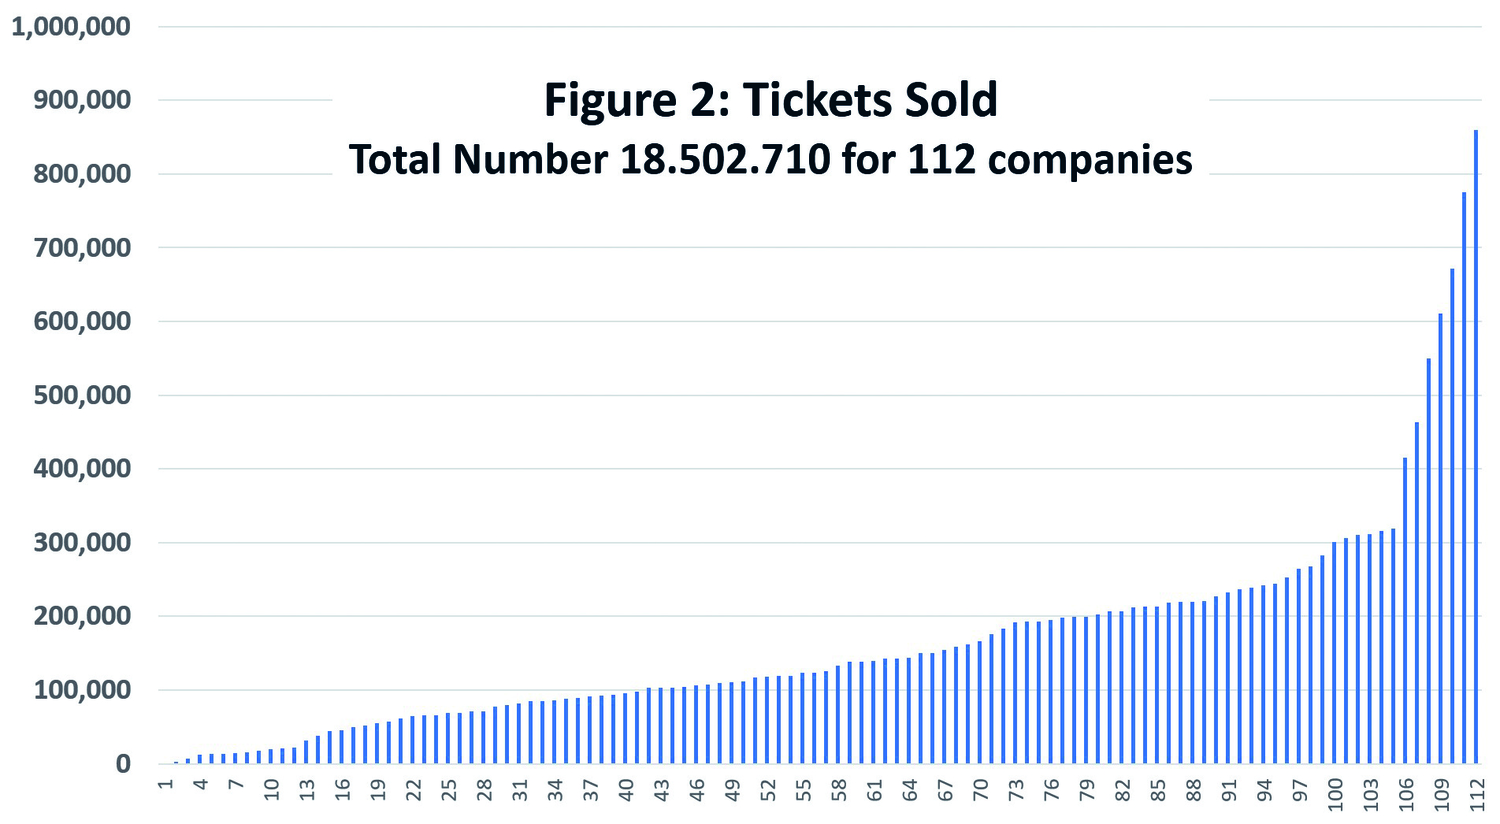
| Tickets Sold (all types) | 18.502.710 | 298 – 859.434 | 165.203 |
| Permanent Staff | 41.975 | 0 – 1.496 | 359 |
| Earned Income | €1.053,3m | €0,008 – 93,5m | €9,0m |
| Contributed Income | €2.694,3m | €0,125 – 108,7m | €23,0m |
| Total Labour Costs | €2.455,4m | €0,087 – 118,9m | €21,2m |
| Total Expenditure | €3.697,8m | €0,153 – 211,6m | €31,9m |
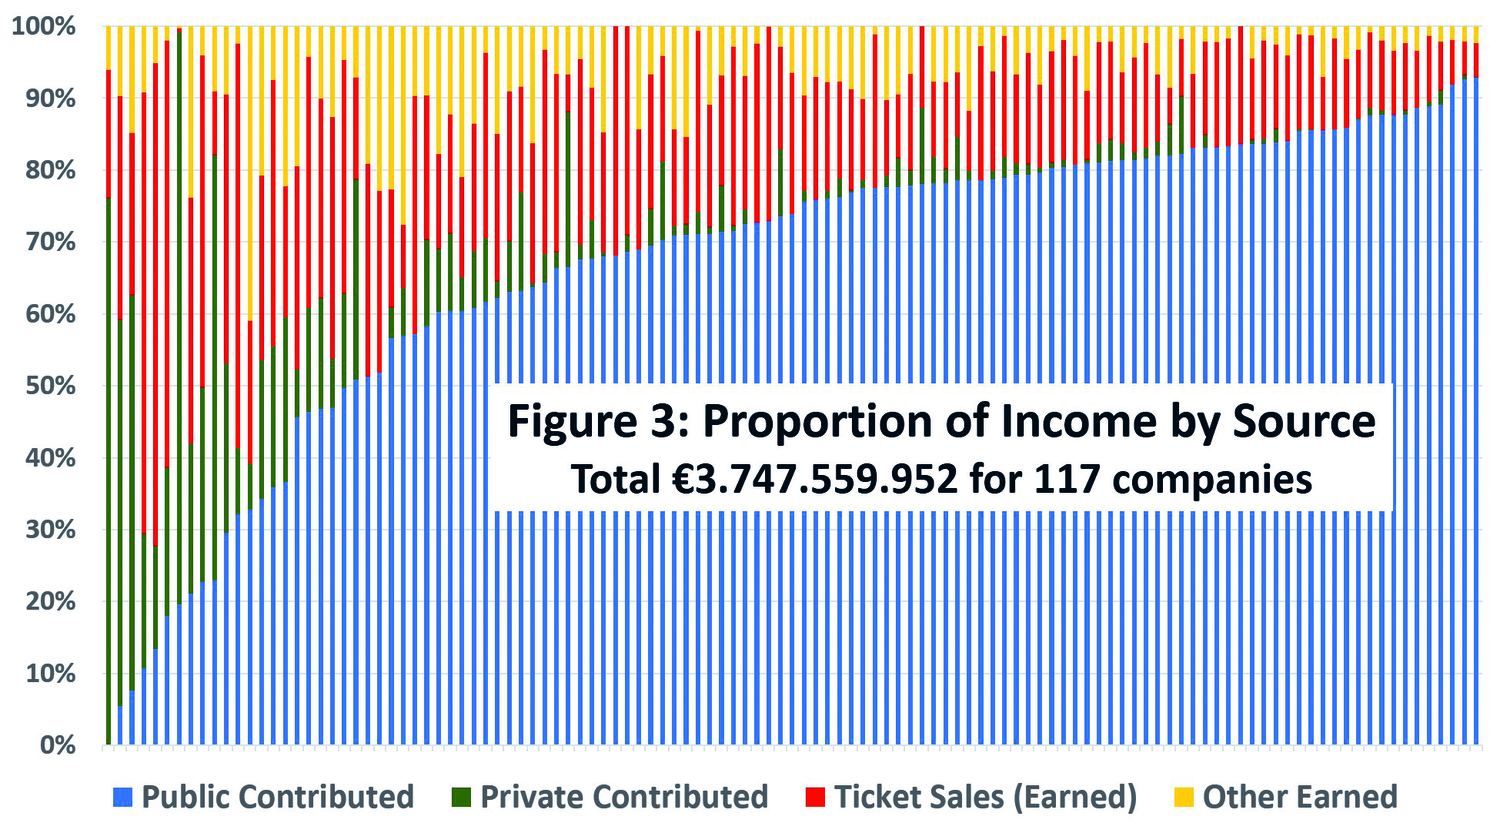
Although subsidy from governments was by far the most important source of income for nearly all member companies at 67% in total, followed by nearly 20% for ticket sales, the proportion of funds coming from these and the other sources varied widely between member companies. Figure 3 shows the split between the four main sources, namely ticket and other sales (both earned income), and public and private (both contributed income).
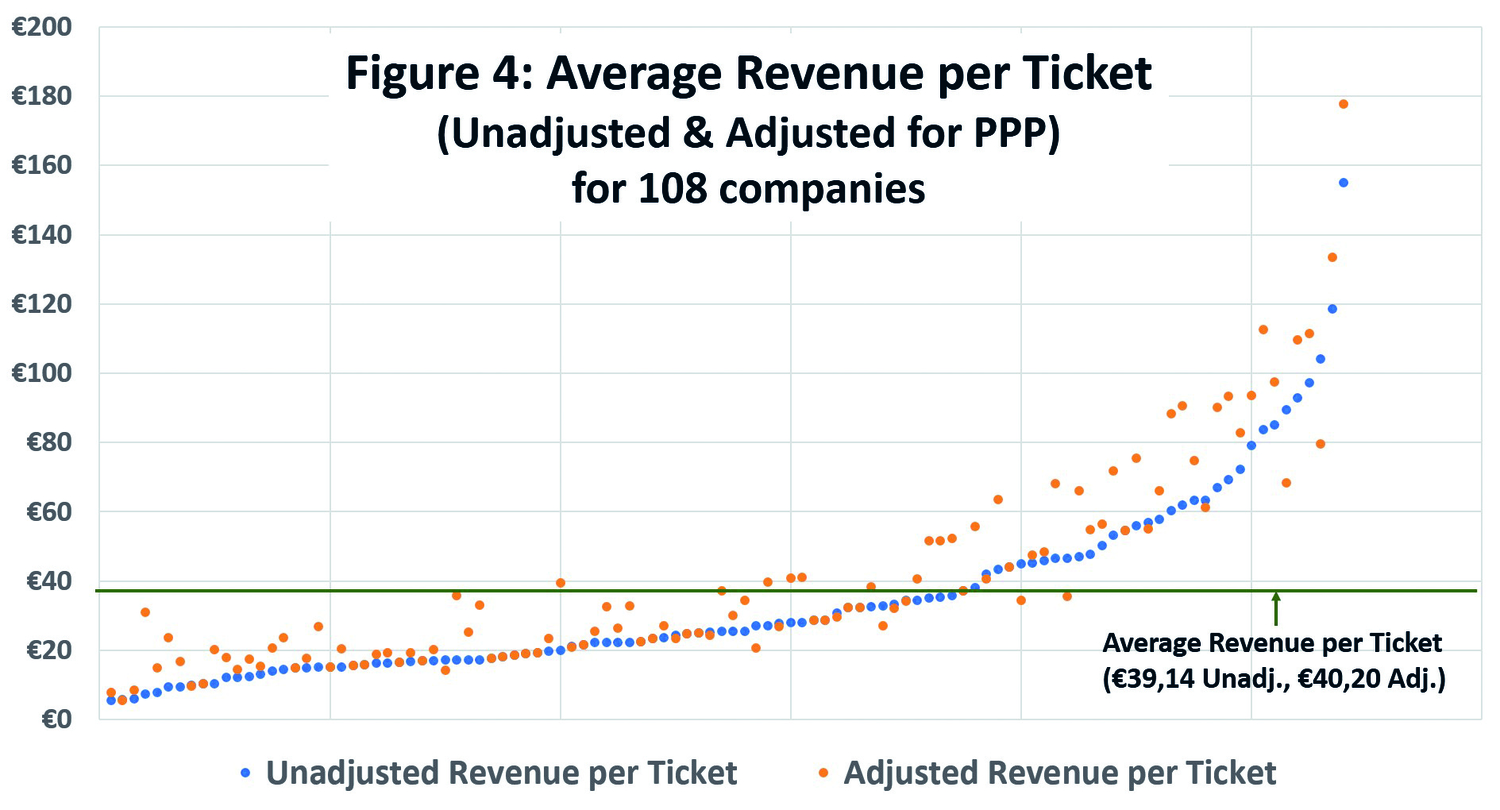
Average revenue per ticket ranged from €5,41 to €155,10 with a total average of €39,14, as shown in Figure 4. Because the economies and per capita incomes of each of Opera Europa’s countries are quite different, we have also adjusted these figures to compare them more consistently using World Bank Purchasing Power Parity (PPP)2 data. This adjustment increases the average revenue per ticket only slightly, to €40,20. Interestingly there was no correlation (~0.7) between ticket prices and the proportion of earned versus contributed income.
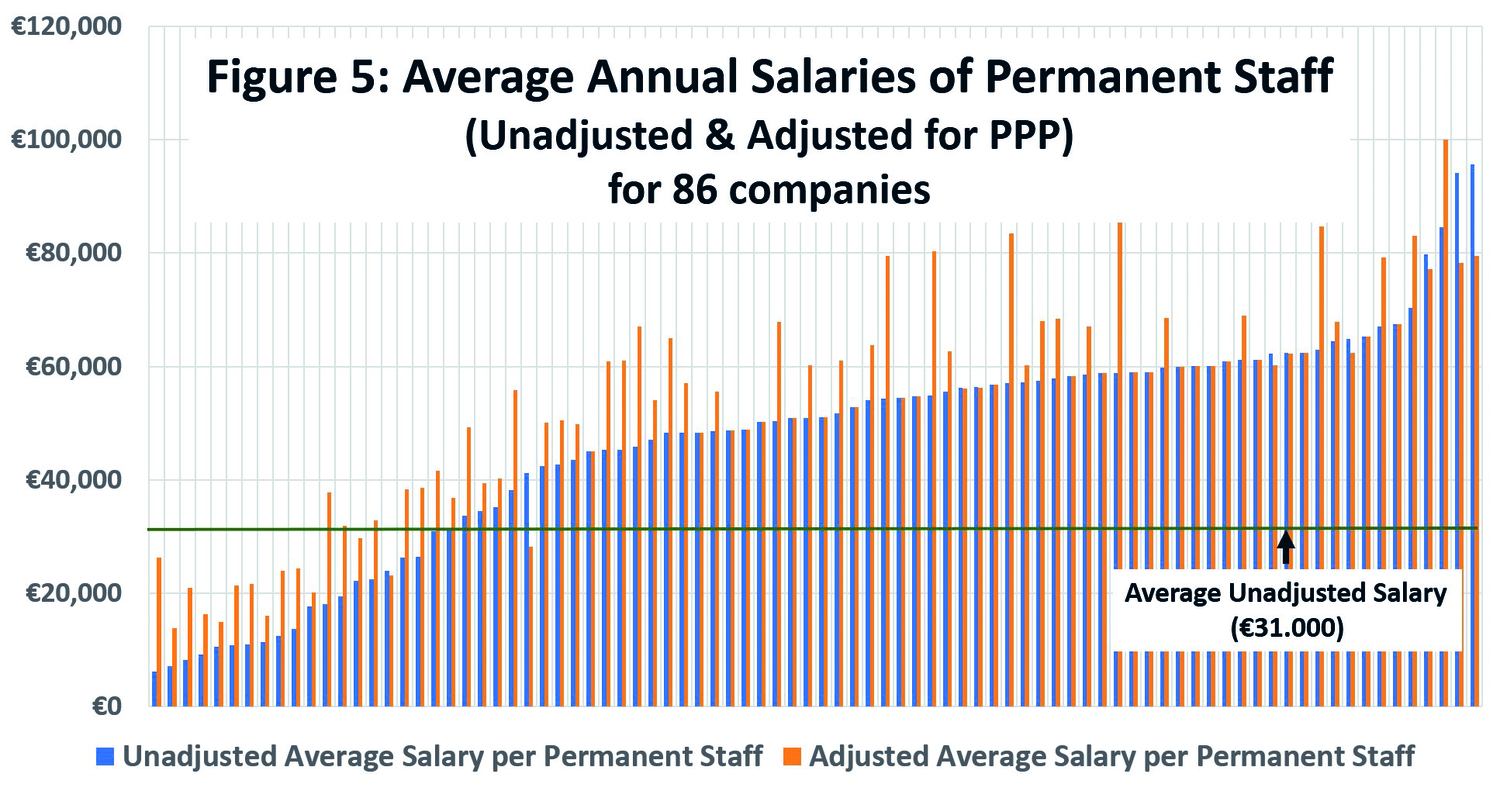
Labour is unsurprisingly the largest item of expenditure. The total cost of both permanent and freelance staff was €2.455 million, or around two thirds of all expenditure. As with ticket prices, you would also expect to see some large differences between countries in the average cost of the total of 41.975 permanent staff employed. Although the sample size for the average salary figures was smaller (86 companies since there are not as yet data for the permanent salaries of all companies), there were indeed large differences ranging from €6.200 to €95.600 per staff, with an average of €31.000, although adjusted for PPP the bottom of the range increased to €13.900, as shown in Figure 5.
So, the picture painted by these results from the preliminary mapping task shows a wide variety in the experiences of member companies when looked at in total. The data are at a high level only, however, and as we move further into the more detailed benchmarking, we expect to be able to draw more instructive comparisons between those opera companies that are more similar to each other, rather than just comparing all companies regardless of their specific characteristics. At a time when financial resources are stretched and funders are seeking greater value for money, we hope that this work can provide facts to defend our position, and comparisons to enable companies to improve their activities by sharing information.
1 Antony Feeny is an economist and accountant, and recently completed his PhD on the financial sustainability of opera and orchestral music.
2 PPP takes into account different prices in different countries by comparing a range of basic goods


